Project 4: Breaking anonymized data
- This project is due at 11:59pm on Monday, Nov 4, 2024.
Description and Deliverables
In this project, you will use 3 different ways to recover private information about individuals from datasets that were anonymized using ad-hoc methods.
To receive full credit for this project, you will turn in the following three files:
-
A file named taxi.txt which contains the taxi medallion number followed by all license plates on separate lines. For example, a valid file might look like:
AA555 111333 5123456 -
A file named bike.txt which contains a comma separated list of locations that my fictional Uncle visited on his bike. For example, a valid bike.txt might look like:
W 15 St & 7 Ave, Atlantic Ave & Fort Greene Pl, E 10 St & Avenue A, 6 Ave & Broome St, E 2 St & Avenue B -
A file named pwned.txt which contains a number, colon, and number on each line.
For example, a valid pwned.txt might look like this:
1:34 2:11 3:222 -
A file named class.txt which contains a number, colon and answer on each line.
For example, a valid class.txt might look like this:
1:21421
2:17 18 19 20 21 21 21 21 21 21 21 21 21 21 21 21 21 21 21
2:17 18 19 19 21 21 21 21 21 21 21 21 21 21 21 21 21 21 21
2:17 17 19 19 21 21 21 21 21 21 21 21 21 21 21 21 21 21 21
3: ...
4: ...
Note the
...is meant to elide the actual numbers.
A Hash-based attack on a Dataset
In 2014, the New York released the notorious Taxi data set which included, at the time, entries that look like this:
37BDEA2E54A3B70CBFA5B0D1C3A75FE2,6D7EE232DC0ACD8C97E4AFB0B0CDDC83,CMT,1,N,2013-01-01 00:04:02,2013-01-01 00:07:36,2,213,.40,-73.97789,40.736755,-73.985062,40.739765
37BDEA2E54A3B70CBFA5B0D1C3A75FE2,6D7EE232DC0ACD8C97E4AFB0B0CDDC83,CMT,1,N,2013-01-01 00:19:27,2013-01-01 00:28:43,2,556,3.80,-73.973778,40.754971,-73.927551,40.761955
37BDEA2E54A3B70CBFA5B0D1C3A75FE2,6D7EE232DC0ACD8C97E4AFB0B0CDDC83,CMT,1,N,2013-01-01 00:37:13,2013-01-01 00:52:18,2,904,6.90,-73.949585,40.744267,-73.85466,40.718494
37BDEA2E54A3B70CBFA5B0D1C3A75FE2,6D7EE232DC0ACD8C97E4AFB0B0CDDC83,CMT,1,N,2013-01-01 01:08:10,2013-01-01 01:22:55,2,885,2.50,-73.952148,40.715321,-73.95974,40.69207
...
37BDEA2E54A3B70CBFA5B0D1C3A75FE2,843DF8AE98AA3542C8F56700F337C179,CMT,1,N,2013-01-01 22:47:32,2013-01-01 23:12:06,1,1474,7.30,-73.991234,40.749687,-73.950935,40.670776
37BDEA2E54A3B70CBFA5B0D1C3A75FE2,843DF8AE98AA3542C8F56700F337C179,CMT,1,N,2013-01-01 23:21:03,2013-01-01 23:32:22,2,678,3.70,-73.974144,40.679619,-74.015823,40.715675
37BDEA2E54A3B70CBFA5B0D1C3A75FE2,843DF8AE98AA3542C8F56700F337C179,CMT,1,N,2013-01-01 23:33:26,2013-01-01 23:43:00,1,573,5.30,-74.015862,40.715599,-73.980659,40.737762
37BDEA2E54A3B70CBFA5B0D1C3A75FE2,843DF8AE98AA3542C8F56700F337C179,CMT,1,N,2013-01-01 23:55:30,2013-01-01 23:57:18,1,107,.70,-73.993179,40.752365,-73.99144,40.760468
which represent the very first rides and last rides on the first day of 2013 by one taxi medallion. These columns correspond to the following fields:
MD5(medallion),MD5(taxi_license),vendor_id,rate_code,store_and_fwd_flag,pickup_datetime,dropoff_datetime, passenger_count,trip_time_in_secs
The first two columns demonstrate NYC’s attempt to anonymize the medallion and licence numbers of the taxis in the dataset. As was quickly discovered, even though a one-way function is a strong cryptographic primitive, its use in this application was ineffective.
The main problem is lack of entropy in the input to the one-way function:
-
In 2013, most NYC Taxi licenses took two forms: either a 6-digit number or a 7-digit number that begins with 5.
-
Medallion numbers take three forms:
- one number, one letter, two numbers. For example: 5X55
- two letters, three numbers. For example: XX555
- three letters, three numbers. For example: XXX555
As a result, this version of the Taxi dataset was taken off the web and replaced by a current version that
removes the medallion and license information. For this assignment, each of you has been assigned a subset of the original dataset. You can find your file at https://shelat.khoury.northeastern.edu/dl/24f-2550/taxi/<username>.dat, so for example, I can retrieve my file using the following command:
$ wget https://shelat.khoury.northeastern.edu/dl/24f-2550/taxi/a.shelat.dat
This file contains all of the taxi rides performed by a given medallion on Jan 15 2013. The medallion is transferred between drivers during the day, and thus there can be a few different cars (and license plates) The medallion is transferred between taxis during the day.
- Use the
hashcatprogram to de-anonymize the records associated with this medallion. In particular find the real medallion value, and determine the license of all taxis that used this medallion on 2013-01-15. Your output should consists of the medallion and all license plates on separate lines in the file taxi.txt.
You will need to use the skills you developed in Project 1 (password cracking) to solve this problem. You can perform the attack on either your VM or a laptop. The actual attack, if you prepare it properly, requires a total of less than 3 minutes of CPU time on a Macbook Pro laptop. If your attack is taking substantially longer, reconsider your strategy.
NYC Citi Bike program
Citi Bike is the nation’s largest bike share program, with 10,000 bikes and 600 stations across Manhattan, Brooklyn, Queens, and Jersey City. Citibike has “invited developers, engineers, statisticians, artists, academics and other interested members of the public to use the data we provide for analysis, development, visualization and whatever else moves you.” They publish a dataset which contains Trip Duration (seconds), Start Time and Date, Stop Time and Date, Start Station Name, End Station Name, Station ID, Station Lat/Long, Bike ID, User Type (Customer = 24-hour pass or 3-day pass user; Subscriber = Annual Member), Gender (Zero=unknown; 1=male; 2=female), Year of Birth.
While this data does not seem to include too much data about the New Yorkers who use CitiBike, this part of the project will show how an attacker can use this type of data to mount attacks on individuals.
The Attack
-
Consider the following fictional narrative:
My uncle was in his 90s in 2015. He served in the war. He lives in the upper west side of New York, specifically on Riverside and 68th, right near Riverside Park. He loved to ride bicycles! However, he doesn’t like carrying his bike up and down the elevator in his apartement building. In 2015, he enrolled for Citi Bike and has been using it whenever the weather is nice.
- Using the Citi Bike dataset, find the 5 most popular locations that my Uncle visited during 2015–2019 aside from his home station. Your answer should consist of one line with the names of 5 stations separated by commas. We will be generous in grading and give credit for several possibilities given that there might be ties in popularity.
Notice that with this data, you could perhaps guess which musuem he likes, which doctors he might visit, etc.
How to start
This Citi Bike public dataset is hosted in Google BigQuery and is included in BigQuery’s 1TB/mo of free tier processing. This means that if you register for a Google Cloud account, you receive 1TB of free BigQuery processing every month, which can be used to run queries on this public dataset. However, you do not need to use Bigtable if you do not want to; you can use any analytics platform that you like.
BigQuery is a remarkable interface to Google’s most powerful data analytics tools. It operates on thousands of machines at a time, and can handle petabyte-scale datasets. In our case, the Citi Bike dataset is <10Gb, and thus the queries you need to run will finish within seconds.
- Go to BigQuery and then click on
Try BigQuery Freebutton in the center of the page.
Alternatively, if you want to signup using a different email, you can enter a credit card number to get a $300 credit. Note: this exercise should not require any charges; all of the queries can be run in the Free-tier of BigQuery. Your Google credits should also enable Bigquery.
- The simplest way to access BigQuery requires you to learn a little bit of “SQL” or “Structured Query Language.” SQL is a declarative programming language that allows you specify rows of a database upon which to perform computations; it is remarkably powerful, but also easy to learn. See this short tutorial for a quick introduction.
The main command words you will need to use are SELECT, FROM, WHERE,
AND and ORDER BY. This project does not require any complex operations such as joining tables, computing aggregates, or grouping rows.
The best way to get started is to explore the language. We will start with a query that identifies a bicycle trip that I took in 2015 when I was on my sabbatical in NYC.
```
SELECT *
FROM `bigquery-public-data.new_york_citibike.citibike_trips`
WHERE starttime = DATETIME(2015,10,27,11,19,11)
AND start_station_id=3169
```
Lets take this query apart. The first `SELECT` is how most queries will begin.
The `*` specifies that you want to retrieve all rows of the data set. If you
just want to retrieve, say, the station name, then you can use `SELECT start_station_name FROM ...` instead. The `FROM` field specifies which data table
you want to retrieve rows from, and the `WHERE` clause specifies the subset of the data table that you want to see. In this case, we are asking for all of the rows that have starttime as "2015-10-27 11:19:11am" from start_station_id 3169 which corresponds to the station at Riverside Dr and W 82nd street. After the query runs, you see the following result:
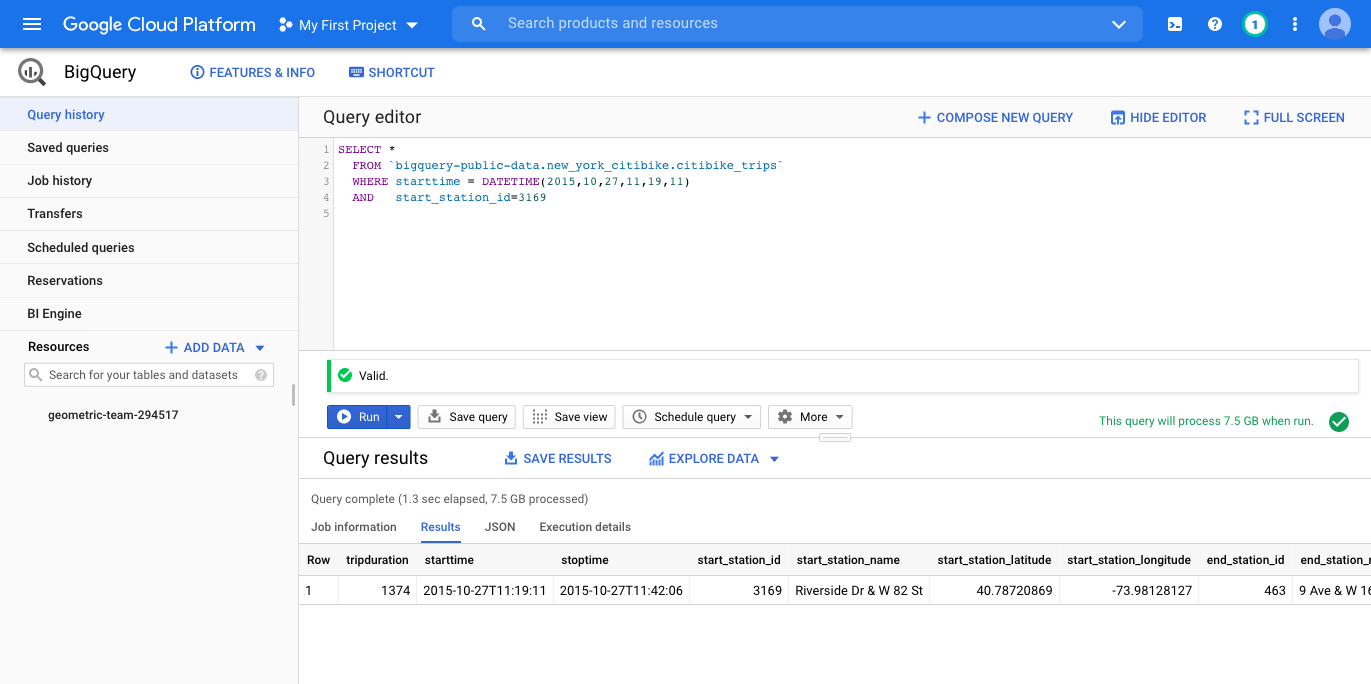
Notice that the result includes both `start_station_name` and `end_station_name` and you can thus see that my trip ended at 9th Ave and 16th street.
You can use, for example, Google Maps to find the location where I [started](https://goo.gl/maps/PLrenMbsmT4bYDxG6) and [ended](https://goo.gl/maps/tGiZsXLvUpS3mRKi6) my trip.
I spent my sabbatical at Cornell Tech, which at the time was located in the Google Building at 16h and 9th Ave; the Citi Bike location has since been moved to 8th Ave.
You can use the table `bigquery-public-data.new_york_citibike.citibike_stations` and Google maps to find the list of all start_station_name values.
Finally, if you want to query rows from a range of dates, you can use the `>` and `<` comparison operators as you would expect. For example, try running this query to see how many people used Citi Bike from my station after me that day, when the station is the busiest, and how many Gen-Xers ride bikes:
```
SELECT *
FROM `bigquery-public-data.new_york_citibike.citibike_trips`
WHERE starttime >= DATETIME(2015,10,27,11,19,11)
AND starttime <= DATETIME(2015,10,27,23,59,00)
AND start_station_id=3169
ORDER BY starttime
```
-
Note that the Citi Bike dataset includes fields like
birth_year,genderwhich you can use in your query to limit the results. -
You will need to write a single SQL query to answer the question posed at the beginning of this section. This assignment shows that if you begin your search for someone with a more unique age than mine, you can pry into more aspects of an individual’s life.
This project does not lay out all of the steps that you will need to do to find the answer. The aim of this project is two-fold: you will gain experience using analysis tools like BigQuery and SQL which allow you to process and sift through very large datasets, and you will learn about how simple techniques for anonymizing data, such as removing direct identifiers, do not protect privacy as expected. In particular, as shown in the Sweeney study, certain fields, when analyzed together, tend to be sparse. In this case, age and location can create sparse entries that leak private data.
An attack on my privacy using auxiliary observations.
In this section, you are going to perform a de-anonymization attack on me using an “anonymized dataset” published by Citibike Boston. In particular, I have been a Citibike user for several years.
Citibike publishes usage data on its services, and in the past, there anonymization efforts were not sufficient. They have since changed their publishing policy to make these types of attacks harder (but not impossible). You are going to perform this attack on me.
The Citibike trip dataset is available in Bigquery as the table cy2550-435508.bluebikes_feb2020.rides. For example, you can get started by seeing a list of all of the station names:
SELECT DISTINCT `start station name`
FROM `cy2550-435508.bluebikes_feb2020.rides`
I live in Brookline and when my children were younger, I would walk them to Pierce elementary school and then use a Citibike to get to Northeastern. My office in Northeastern was in ISEC (820 Columbus Ave) which is near the Ruggles T stop. These are facts that anyone can deduce about me via a small amount of auxiliary information. Using these facts, some educated guessing, and Bigquery, answer the following questions:
- In which year does Citibike think I was born? Provide your answer as
1:Xwhere X is a year, e.g., 1999. - How many times in February 2020 did I bicycle to ISEC using a Citibike? Provide your answer as
2:Y - How long would it take me on average? Provide your answer as
3:Zwhere Z is a answer in seconds rounded to the nearest integer.
This section of the assignment will require you to learn about the schema of this dataset and how to query it properly to retrieve the answers.
A Constraint-based Attack on a Dataset
The final type of attack on anonymous data that we explore is more subtle. Suppose that I announce the following statistics about grades in a fictional seminar class that I offered last year. This table is meant to provide information about the students in my class, their age demographics, the dorms and majors. I do not intend to reveal any information about any particular individual in my class. Indeed, no single line of the table seems to leak any information about individuals.
| Statistic | Number | Mean | Median | Max |
|---|---|---|---|---|
| (1) Total | 19 | 17.895 | 18 | – |
| (2) On-campus | 13 | 17.308 | 17 | – |
| (3) Non-CS major | 3 | 20 | 20 | 20 |
Questions
For the sake of concreteness, lets assume that the students in the seminar are between the age of 17 and 21. Note, when taking the median for a list of even length, the average of the two middle elements is given.
For the following questions, provide all of your answers in sorted order.
-
Given that there are 19 students in the class, how many total possible combinations of ages are there overall (consider all unsorted combinations)? Provide your answer as
1:Xon its own line where X is your numeric answer. -
To simplify, lets now just consider the combinations that occur in sorted order of age. Determine how many such combinations yield a mean of 17.895 and a median of 18 ?
List all unique combinations, one per line prefixed by the characters
2:, with the ages in sorted order and separated by a space. For example,2:17 18 19 20 21 21 21 21 21 21 21 21 21 21 21 21 21 21 21could be one line (although it does not have the correct average).
To solve this problem, consider all of the ages in the class. Let $x_{17}$ be the number of 17 year olds in the class, $x_{18}$ be the number of 18-year olds, etc. Then you know that
$$ x_{17} + x_{18} + x_{19} + x_{20} + x_{21} = 15 $$
If the mean was 17.895, then it implies that
$$ 17\cdot x_{17} + 18\cdot x_{18} + 19\cdot x_{19} + 20\cdot x_{20} + 21\cdot x_{21} = int(17.895 \cdot 19) $$
The question asks you to count how many ways that can happen. Note: you will need to use the fact that the median is 18 to limit the possibilities. Recall that the median is the middle element in the list of sorted ages; this means that 18 will be the 10th element in the sorted list. As a starting point, consider the largest number of 17 year olds who can be in the class. Can there be 19? Can there be 18? etc. Similarly, can there be only 1 17 year old in the class and still reach the given average?
-
Given the list from question 2, how many of those combinations allow for the 13 people who live oncampus to have mean 17.308 and median 17 ? List these combinations, one per line prefixed by the characters
3:with the ages sorted.Solving this question will require testing each solution from the question above to see if it could fit these additional constraints.
-
Finally, given that the 3 non-majors have mean 20, median 20, and max 20, what are the ages of everyone in the class? Provide the final list of 19 ages in sorted order prefixed by the characters
4:.
Note, your final file should be named class.txt.
Here we used simple attributes like age, dorm, major. The point of this is to show that revealing information such as average score and median on an exam, and homeworks, etc. can be used in these kinds of attacks to re-identify individual grades, which is certainly more objectionable.
Submitting Your Project
- Create a new directory named
project4. - Add the files
bike.txt,taxi.txt,pwned.txtandclass.txtto theproject4directory. - Submit in gradescope.
- You can update your files as many times as you like before the deadline. Just makes your changes locally, and then add them to another commit.
Grading
This project is worth 10% of your final grade, broken down as follows (out of 100):
- 30 points - bike answers
- 20 points - taxi answers
- 10 points - pwned answers
- 40 points - Class answers
- Lines 1,4 are worth 5 points each
- lines 2,3 are worth 15 points each